By Harriet Cornachione, GSA Science Communication Intern – Ph.D. Candidate in Geology Utah State University
Indiana geologists locate the southern boundary of the Laurentide ice sheet
Building on the efforts of his predecessors and using new technologies to date sediments, geologist Henry Loope and his team at the Indiana Geological and Water Survey (IGS) mapped the Indiana extent of a vast glacier called the Laurentide ice sheet. At its greatest size – called the Last Glacial Maximum – the immense sheet of ice covered much of Canada and the northern United States (Figure 1). In some places the ice was about 4 km (2.5 miles) thick! Subject to episodes of advance and retreat through the Quaternary Period about 2.5 million years ago, the ice mass began its final retreat about 20,000 years ago. Today only a small remnant of the Laurentide Ice Sheet remains – the Barnes Cap in the Canadian Arctic. Studying the history of past climates, especially the glacial (cold) and interglacial (warm) climates, helps scientists understand our present and future climates. The sediments created by the glaciers also provide storage for groundwater systems that supply water for local agriculture and community use.

Loope and his team used historic geological reports from the 1960’s to help locate rock and soil exposures that might be useful for their investigations. They revisited these sites, clearing off the slopes and small rock exposures along streams and hillsides and finding new exposures where local streams had uncovered new layers. Here they collected samples of wood, shells and mineral grains in the rock to obtain ages of the deposits using new dating methods. Because many of the gravelly layers appear similar, the ages provide confirmation that the geologists have mapped the units correctly. Groundwater is contained in these rocks, so it is important to understand which layers are connected, and where those layers may be interrupted by a surface canal or stream.
“Agriculture is a key way of life in much of rural Indiana and protecting the water resources is important to everyone,” Loope explains. “A lot of our work goes to the Clean Water Act protections (CWA Summary) to show the connections between surface water and groundwater.” He sees the 21st century as a “water century,” with a need to understand the three-dimensional geologic framework that lies below farm fields and cities alike, storing clean water resources.
At the recent Geological Society of America (GSA) Annual Meeting in Indianapolis, Loope shared results of this multi-year mapping project on the “Kirk Bryan” field trip navigating the ancient glacier’s edge. Since 2006, the Kirk Bryan Field Trip has been sponsored by GSA’s Quaternary Geology and Geomorphology Division and promotes scientific discussion by showcasing sites of ongoing local research into processes and events shaping the landscape in which we live.
Exploring the Laurentide’s Edge
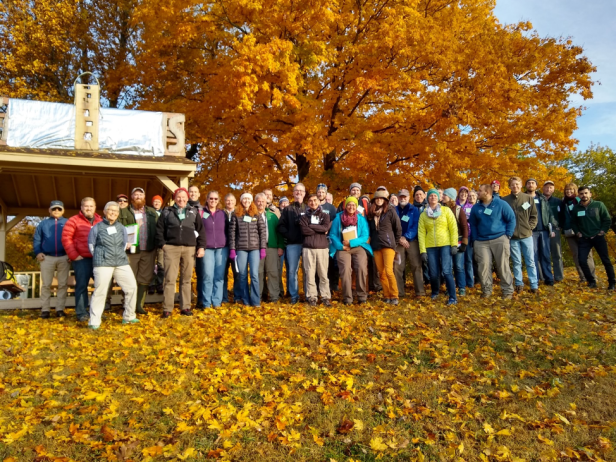
In the crisp autumnal air, backdropped by red and gold trees, IGS glacial geologists Loope and José Luis Antinao led a group of approximately 60 scientists on a trek to see rock exposures and sediment cores, showing participants the ancient glacial deposits and the locations of their age samples.
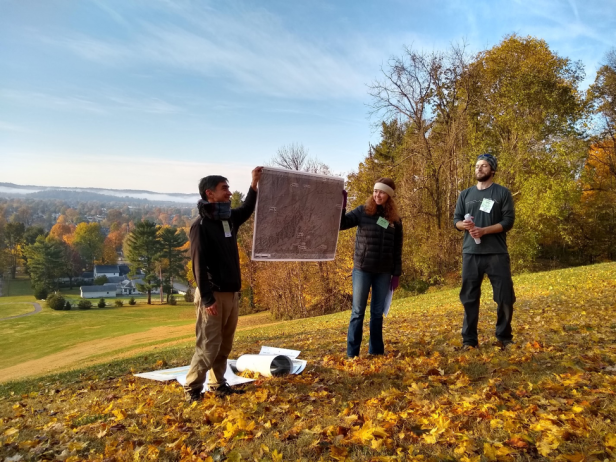
On the first stop, Loope and Antinao bounded up a sledding hill in a Martindale park created by the glaciers and enjoyed by local children each winter. Fortified by local donuts and coffee, we ascended the hill to a great view across the White River Valley. Here Loope points out eolian (wind-blown) dune sand deposits and distant hills of glacial till deposits.
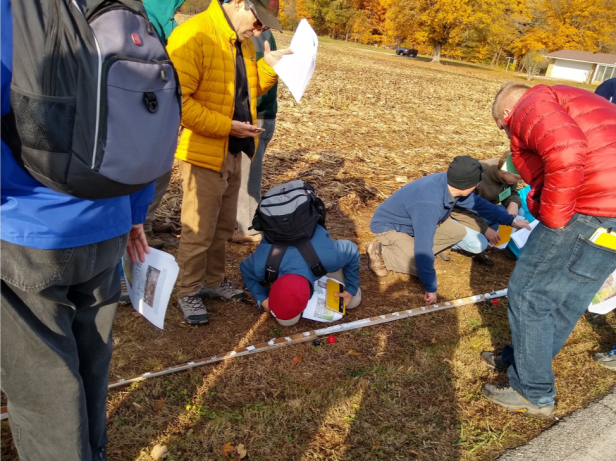
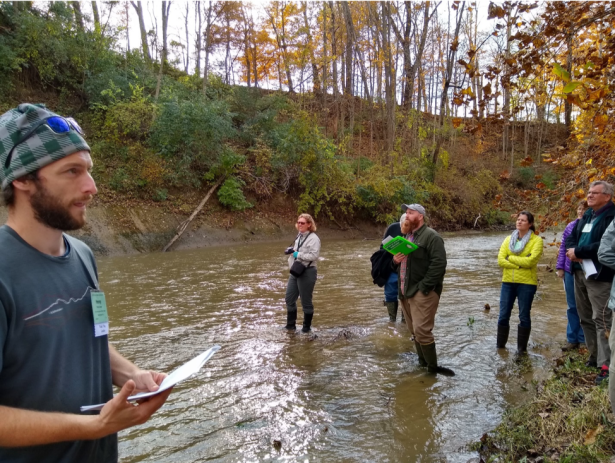
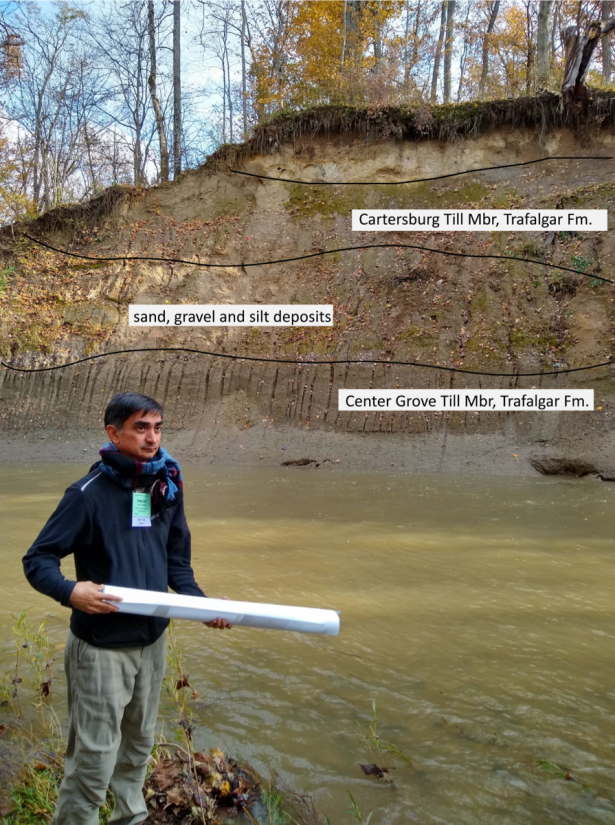
We visited several streams, still running high from a recent rainstorm event. Loope pointed out layers of fine-grained silt and clay deposits formed by ice-dammed lakes as well as deposits of gravel left by melting ice, swirly and jumbled like marble cake batter, along with dark layers that once were surface soils. These rock and soil deposits, along with sediment cores collected on the lands of willing farmers, were described in detail and sampled to obtain their ages.
When and How the Ice Melts
Loope and his team’s meticulous and detailed work led to an “aha moment”. They located the extent of the Laurentide ice sheet at the Last Glacial Maximum (LGM). Loope says new dating technology confirmed their interpretation based on the geology they saw. He expresses respect and appreciation for the area landowners who have allowed his team access to their properties to view outcrops as well as to drill subsurface cores. Such cooperation is important in a region of limited rock exposures and little public land.
The project presents records of past climate used by scientists to help understand present and future climate. Based on the geological evidence and new age dates on ancient vegetation, Loope and his team found that the ice retreated (melted) at about a rate of 40 meters per year in this area. They also discovered and mapped two late stage glacial advances here, including a record of a much earlier ice sheet advance. Identifying past climate processes helps scientists understand the rates of natural processes like glacial melting. This information can help scientists and others understand climate responses and develop strategies in our region to adapt to changing climates.
Beyond reconstructing past climate, the team produced maps that are used by the public to understand issues like water resources. The maps help people with land use planning and water resource questions, like where to locate a septic system or why a well went dry, and they provide information for municipalities to solve water quality problems like toxic algal blooms or long-term water resource planning. Significantly, this mapping in Indiana is consistent with independent work in Ohio and Illinois, a point thoroughly discussed by geologists from those states who attended the field trip (Figure 6 a-b). Groundwater resources do not stop at state borders. Water supply issues are especially of public concern in times of drought, and geologic maps by geologists like Loope and his team provide valuable information to the public about water quantity and quality.
As Loope explains, his biggest challenge is often “just getting things done.” Continually improving technology systems demand his attention to “keep pace” with new computer software. At the same time scientific technologies are rapidly evolving that require working in teams combining many areas of expertise to solve the “geologic three-dimensional puzzle of what kinds of rocks lie underneath our feet and where the groundwater flows.” He is modest about his own contributions, saying “…science works in steps. Standing on the shoulders of giants who have come before me, I’ve added a layer of knowledge. In 20 years, someone should add another layer of understanding. That is how science works.”
