by Timothy H. Dixon and Makan A. Karegar, School of Geosciences, University of South Florida, Tampa
The U.S. recently marked the tenth anniversary of Hurricane Katrina and the devastation visited on New Orleans. This was the nation’s costliest natural disaster, with combined insured and uninsured losses totaling approximately $200 billion. A total of 1,800 people lost their lives across several states, with nearly 1,000 people drowning in the city.
While the hurricane and levee failures were the immediate cause of the disaster, decades of prior land subsidence that left parts of the city several meters below sea level was also a key factor. The extreme subsidence is generally attributed to compaction of young sediments, combined with oxidation of organic-rich soils in former marshlands that had been drained for urbanization; once exposed to the atmosphere, the peat-rich material decays rapidly. Low elevation left the city vulnerable to a flood disaster, a point made repeatedly by scientists in the decades prior to Katrina. Unfortunately, the warnings went unheeded.
Earth scientists do not have a great track record when it comes to giving effective warnings about future disasters. While we may be well aware of future dangers associated with potential future floods or earthquakes, we are usually not able to give specific dates or places indicating when and where a disaster will strike. This lack of specificity makes it hard to get the attention of the public and policy makers in a media landscape dominated by celebrity scandals or terrorist attacks.
The authors of this article do not have a solution for the “when” problem. But at least for coastal flooding, we have a partial solution for the “where” problem: low elevation coastal areas that are currently experiencing subsidence are more likely to flood in the near future compared to areas that are not experiencing subsidence. Modern satellite geodesy gives us the tools to specify areas most at risk using this criterion. Below we give some examples.
A recent Global Positioning System (GPS) study of subsidence in the Mississippi Delta indicates that the southern part of the delta is at high risk of flooding and permanent land loss, due to the combination of low elevation, high rates of subsidence and sea level rise. Relative sea level rise (the combination of land elevation going down and sea level going up) in the southern delta is now approaching 1 cm/yr (Figure 1).

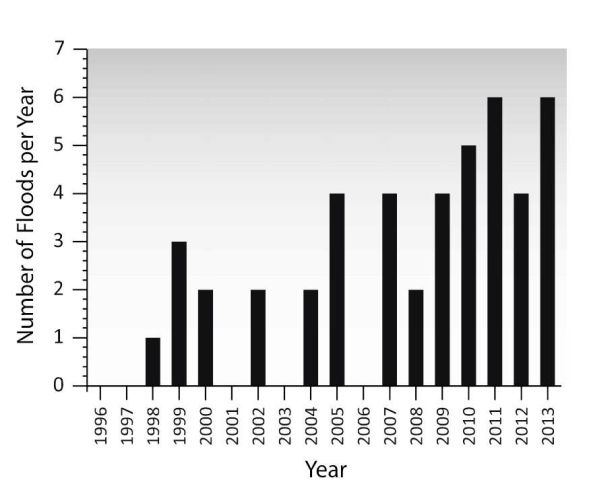
Tidal-induced local floods, sometimes called “nuisance flooding” or “sunny day flooding” are also becoming more frequent in low lying coastal areas. In the US, Miami Beach and Fort Lauderdale have both experienced increased nuisance flooding frequency in the last few decades (Figures 2 and 3). Other parts of the US eastern seaboard, on the ocean side of the “fall line”, the geomorphic boundary between the Appalachian province and the coastal plain, are at low elevation (less than 10 meters above sea level), and have also experienced increased nuisance flooding. Many of these towns here were established hundreds of years ago, in the late 1600’s or early 1700’s, and experienced little flooding for most of their history. Sea level rise since the early 1900’s has now brought water levels to a point where they can cause minor damage during periods of high tide and/or strong offshore winds, and major damage during hurricanes and tropical or extra-tropical storms. But other factors are also at play.

Recent studies by NOAA and other scientists have looked at the frequency of nuisance flooding along the eastern seaboard, and how frequency has increased in the last few decades (Figure 4). In addition to the temporal trends indicated by the NOAA data, there are interesting spatial patterns as well. In particular, there are two “peaks” in flood frequency, one near Chesapeake Bay between 38.5° N and 41.5○ N latitude, and the other between about 32° N and 36° N latitude.

The cause of increased flooding in the northern zone (along or near Chesapeake Bay) is well known to geologists who study the effects of past glaciations or the viscosity structure of Earth’s mantle: Glacial Isostatic Adjustment (GIA), the long term response to glacial unloading, as the Laurentide ice sheet melted and retreated from its maximum extent around 20,000 years ago. In this particular case, GIA causes the land surface to go down, as the peripheral bulge at the edge of the former ice sheet collapses. The process is mediated by the viscosity of the Earth’s mantle, which delays the adjustment. Geological measurements here indicate that land subsidence is still going on, at a rate of about 1.3 – 1.4 mm/yr.
At first glance, 1.4 mm/yr of subsidence may seem like “small potatoes” compared to the current rate of sea level rise associated with global warming: satellite data suggest a global average rate for the last two decades that is more than double the GIA rate, around 3.3 mm/yr – Figure 5). But it’s important to remember that flood potential reflects the integrated effects of past subsidence, not just the current rate of change (of course the current rate of relative sea level rise is critical for future planning). Several hundred years of slow subsidence from GIA since the towns in this region were first established means that they are now about one half meter lower than their original elevation. And it’s only getting worse. At the present time, the rate of change of relative sea level (RSL) at Chesapeake Bay, given by the sum of GIA (land moves down at 1.3 – 1.4 mm/yr) plus local sea level change (ocean surface moves up). If we assume that the global average rate (3.3 mm/yr) applies, then Chesapeake Bay is currently facing a total of 4.6 mm/yr of RSL rise. This is a minimum because as Greenland loses mass, the associated reduction in gravitational attraction that had held “extra” ocean water closer to that continent tends to raise water levels along most of the eastern seaboard as the additional water moves away from Greenland. Satellite altimetry data indicate higher rates of sea level rise along the eastern seaboard relative to the western seaboard of the US; rates may be least twice the global average. Changes in Gulf Stream circulation and decadal scale climate variability have also been postulated to affect regional sea level here. Bottom line: were can predict with a high degree of confidence that the Chesapeake Bay area and towns and cities near the GIA maximum will experience many more nuisance flood episodes in the next few decades.

The other peak in nuisance flooding (32° – 36° N latitude, including parts of South and North Carolina) is more enigmatic. Karegar et al. (2016) suggested that ground water extraction from coastal aquifers over the last few decades is a contributing factor, resulting in modern subsidence rates that are double the rate from geological measurements (averaging over a much longer time) and GIA models. In the short term (next few decades) this is a useful result because ground water extraction practices can be modified, reducing or eliminating subsidence, and perhaps even promoting moderate uplift via ground water recharge. In the short term, we can reduce this cause of nuisance flooding.
It’s also important to realize that some short term flood mitigation measures, necessary as they are, have costs beyond the initial financial investment. The city of Miami Beach, responding to the flood trends shown in Figure 3, recently spent million of dollars installing new pumps to flush flood waters into nearby Biscayne, a major tourist area, famous for swimming, boating and fishing. Unfortunately, those flood waters are badly contaminated. The untreated flood water is hundreds of times higher in enterococci (a bacteria that indicates fecal contamination) compared to levels recommended by the US Environmental Protection Agency. Miami Beach depends on tourism, and these finding are not exactly a great tourist draw.
Long-term considerations are even more important. On time scales of 50-100 years and longer, many of Earth’s coastal regions will experience a combination of more intense Hurricane Katrina-like catastrophic events and more frequent nuisance flooding, as ever-rising sea levels associated with global warming eventually swamp coastal defenses. In this view, nuisance flooding can be considered a wake up call, a clear indicator of future, more catastrophic events that our coastal areas will face if we ignore the warning signs. On the positive side, 50-100 years is sufficient time for us to firm up coastal defenses, and retreat from coastal areas that are most at risk or most difficult to defend. Perhaps we can even consider mitigating the worst effects of future global warming by starting to moderate our use of carbon-intensive energy. Some of this has already started. The rapid growth of LED light bulbs, which reduces electricity demand, the replacement of dirty coal-fired power plants with cleaner natural gas, wind and solar plants, and the rapid growth of hybrid and all-electric vehicles, shows that we can do better, even in the absence of government regulation. Lets get to work!
Timothy H. Dixon is a Professor at the University of South Florida, School of Geosciences, Tampa. Parts of this article are based on Chapter Seven of his new book “Curbing Catastrophe”, published by Cambridge University Press.
Makan A. Karegar is a Ph.D. candidate at the University of South Florida, School of Geosciences, Tampa. His dissertation research involves the use of satellite geodesy, including high precision GPS and GRACE gravity data, to study several aspects of global change, including coastal subsidence, ground water extraction, and carbon sequestration.
References and Further Reading
Dixon, T. H. (2017) Curbing Catastrophe: Natural Hazards and Risk Reduction in the modern World. Cambridge University Press, Cambridge, New York, Delhi, 300p.
Karegar, M. A., Dixon, T. H., Malservisi, R., Kusche, J., & Engelhart, S. E. (2017). Nuisance Flooding and Relative Sea Level Rise: the Importance of Present-Day Land Motion. Submitted to Nature Geoscience.
Karegar, M. A., Dixon, T. H., & Malservisi, R. (2015). A three-dimensional surface velocity field for the Mississippi Delta: Implications for coastal restoration and flood potential. Geology, 43(6), 519-522.
Karegar, M. A., T. H. Dixon, and S. E. Engelhart (2016). Subsidence along the Atlantic Coast of North America: Insights from GPS and late Holocene relative sea level data. Geophysical Research Letters, 43(7), 3126-3133.
Kopp, R. E. (2013). Does the mid‐Atlantic United States sea level acceleration hot spot reflect ocean dynamic variability? Geophysical Research Letters, 40(15), 3981-3985.
Moftakhari, H. R., AghaKouchak, A., Sanders, B. F., Feldman, D. L., Sweet, W., Matthew, R. A., & Luke, A. (2015). Increased nuisance flooding along the coasts of the United States due to sea level rise: Past and future. Geophysical Research Letters, 42(22), 9846-9852.
Nerem, R. S., D. P. Chambers, C. Choe, and G. T. Mitchum. Estimating mean sea level change from the TOPEX and Jason altimeter missions. Marine Geodesy 33, no. S1 (2010): 435-446.
Ray, R. D., & Foster, G. (2016). Future nuisance flooding at Boston caused by astronomical tides alone. Earth’s Future.
Sallenger Jr, A. H., Doran, K. S., & Howd, P. A. (2012). Hotspot of accelerated sea-level rise on the Atlantic coast of North America. Nature Climate Change, 2(12), 884-888.
Schiermeier, Q. (2014) Holding back the tide. Nature, 508, 164-166.
Sweet, W. V., & Park, J. (2014). From the extreme to the mean: Acceleration and tipping points of coastal inundation from sea level rise. Earth’s Future, 2(12), 579-600.
Sweet, W.V., J. Park, J. J. Marra, C. Zervas, S. Gill (2014), Sea level rise and nuisance flood frequency changes around the United States, in NOAA Technical Report NOS COOPS 73, 53 pp.
Wdowinski, S., Bray, R., Kirtman, B. P., & Wu, Z. (2016). Increasing flooding hazard in coastal communities due to rising sea level: Case study of Miami Beach, Florida. Ocean & Coastal Management, 126, 1-8.
Wendel, J. (2016) Dirty water: Unintended consequences of climate resiliency. EOS: Earth and Space Science News, 97, #8, 3.
Yang, Q., Dixon, T. H., Myers, P. G., Bonin, J., Chambers, D., & Van Den Broeke, M. R. (2016). Recent increases in Arctic freshwater flux affects Labrador Sea convection and Atlantic overturning circulation. Nature communications, 7.

Find examples of other cities that had to adjust to coastal flooding. Venice, Italy is an internationally known example with modified buildings, canals with boat traffic, a history of trade, and a destination tourist attraction. I wonder, where else in the world have similar adjustments and modifications been made? Would it be inevitable to fill in first floors, use the second floors for business, and travel using boats on roads converted into canals, or to abandon cities and make them into water parks? What would you plan for cities with increasing coastal flooding, that you would like to live in?